Your First Schedule SOLO+
Goal: Turn a priced, costed scenario into a working CPM schedule with a Gantt chart, an S-curve, and an exported programme.
You'll need:
- A scenario with matched items and URAs — schedule durations are derived from URA daily-output figures. See Coverage, URA & Cost Review. Items without a URA get a placeholder one-day duration, which isn't useful for a real programme.
Step 1 — Set your calendar and start date
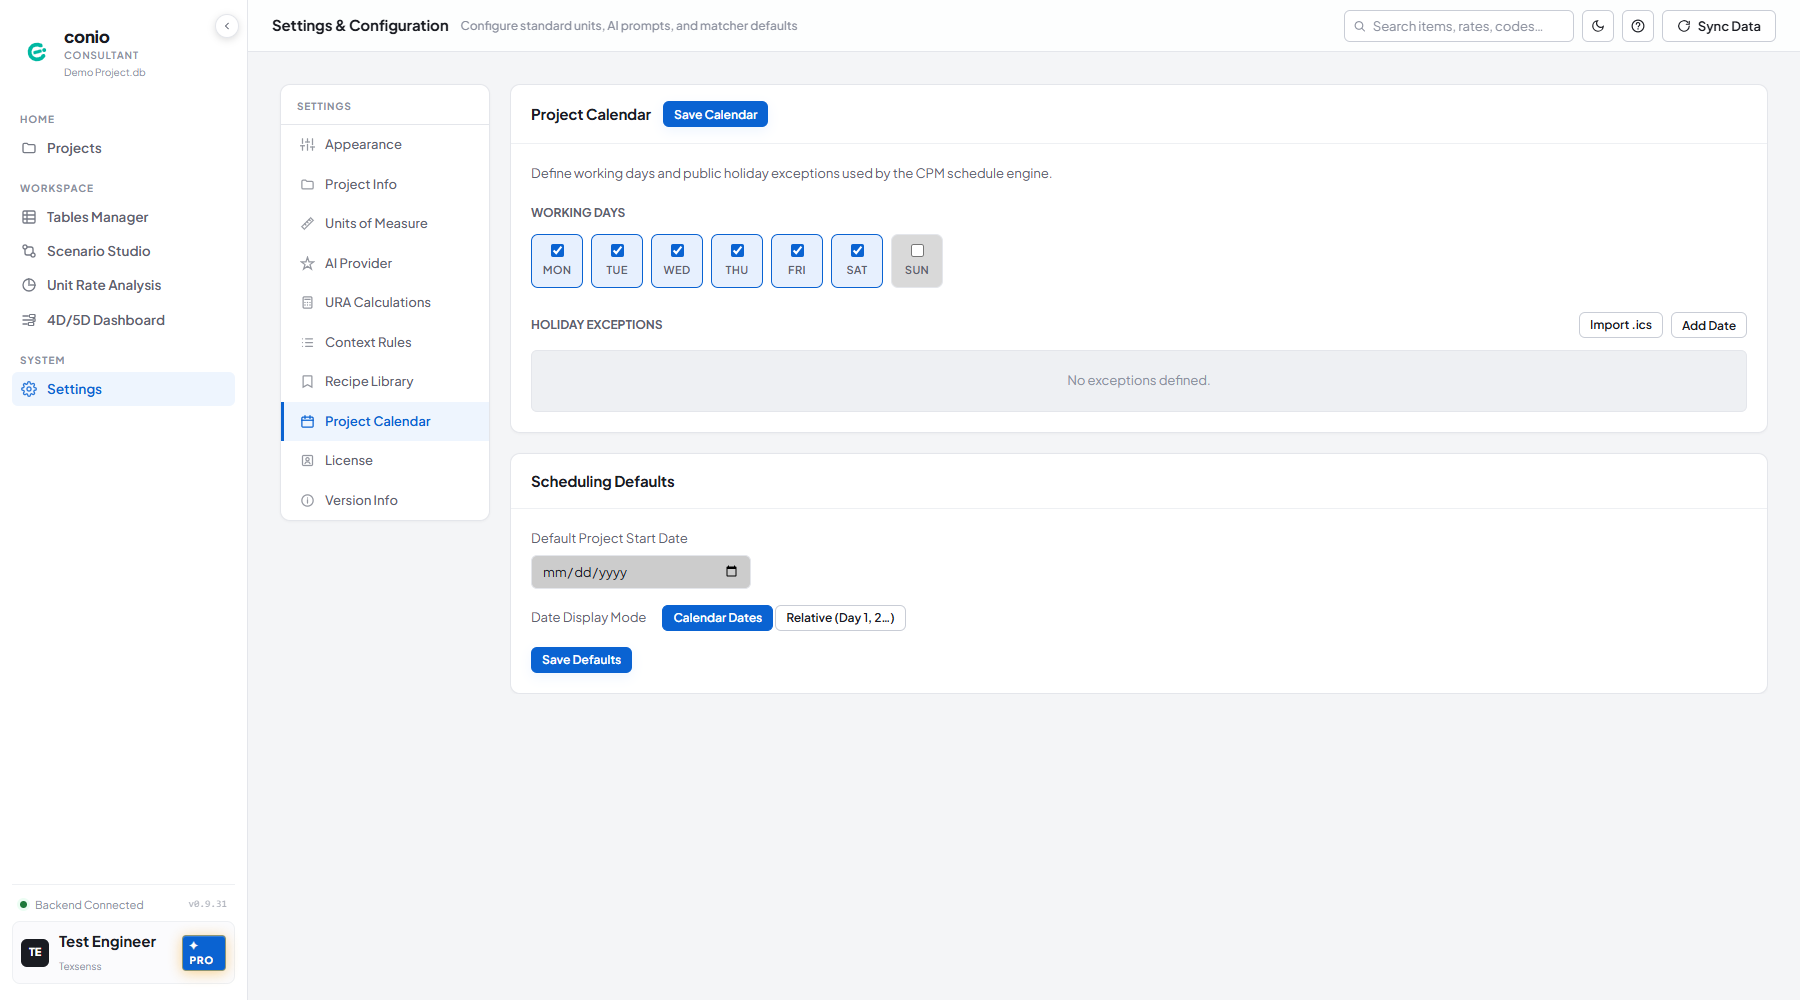
- Open Settings → Project Calendar.
- Check/uncheck Working Days for your working week, and add holidays under Holiday Exceptions (one at a time with Add Date, or in bulk with Import .ics).
- Click Save Calendar.
- Open the 4D/5D Dashboard from the left sidebar — it opens in a new tab.
- Select your scenario from the dropdown, then set the Project start date field next to it.

Step 2 — Generate the baseline schedule
- Click Refresh in the toolbar (shown as Generate Schedule the first time, before any schedule exists for this scenario).
Conio runs the CPM forward/backward pass and renders the Gantt using a simple sequential order for any tasks with no predecessor links yet.
Step 3 — Sequence it with AI Schedule (optional but recommended)
A purely sequential first pass usually front-loads cost unrealistically. Let AI Schedule infer construction-logical predecessors instead:
- Click AI Schedule in the toolbar.
- Leave the defaults (Max iterations 3, Accept threshold 0.65, Protect my links on) unless you have a reason to change them.
- Click Run Optimisation.
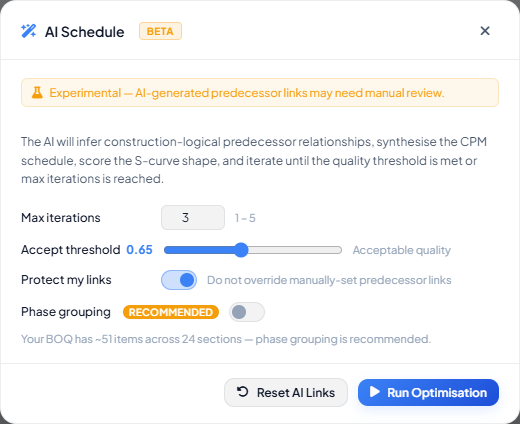
The AI iterates until the S-curve quality score clears the accept threshold or the iteration limit is reached. Tasks it couldn't confidently sequence are highlighted amber for manual review.
Step 4 — Review the Gantt and S-curve
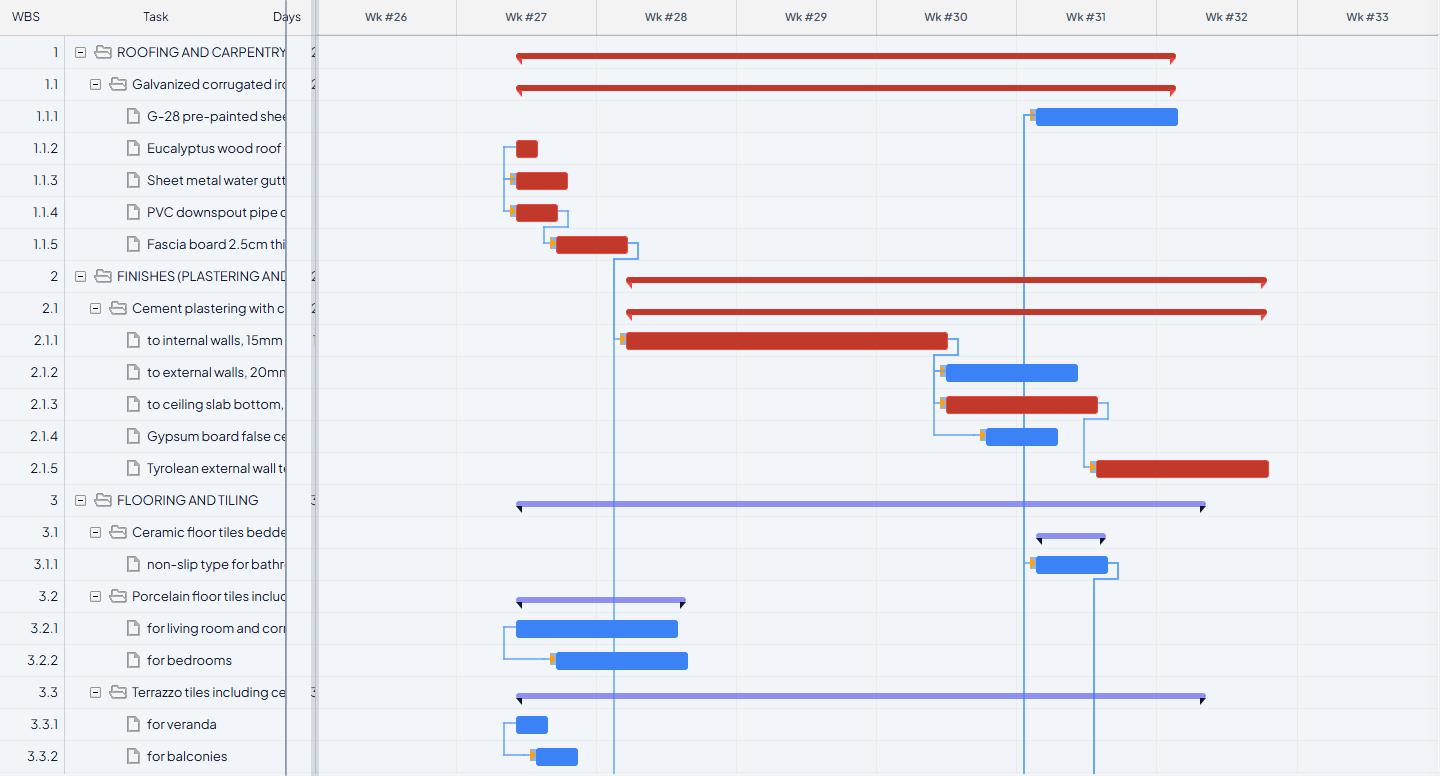
- On the Gantt (4D) tab, check the critical path (red) makes sense and no task durations look wrong.
- Switch to the S-Curve (5D) tab to review the cash-flow distribution and its quality badge.
Step 5 — Export
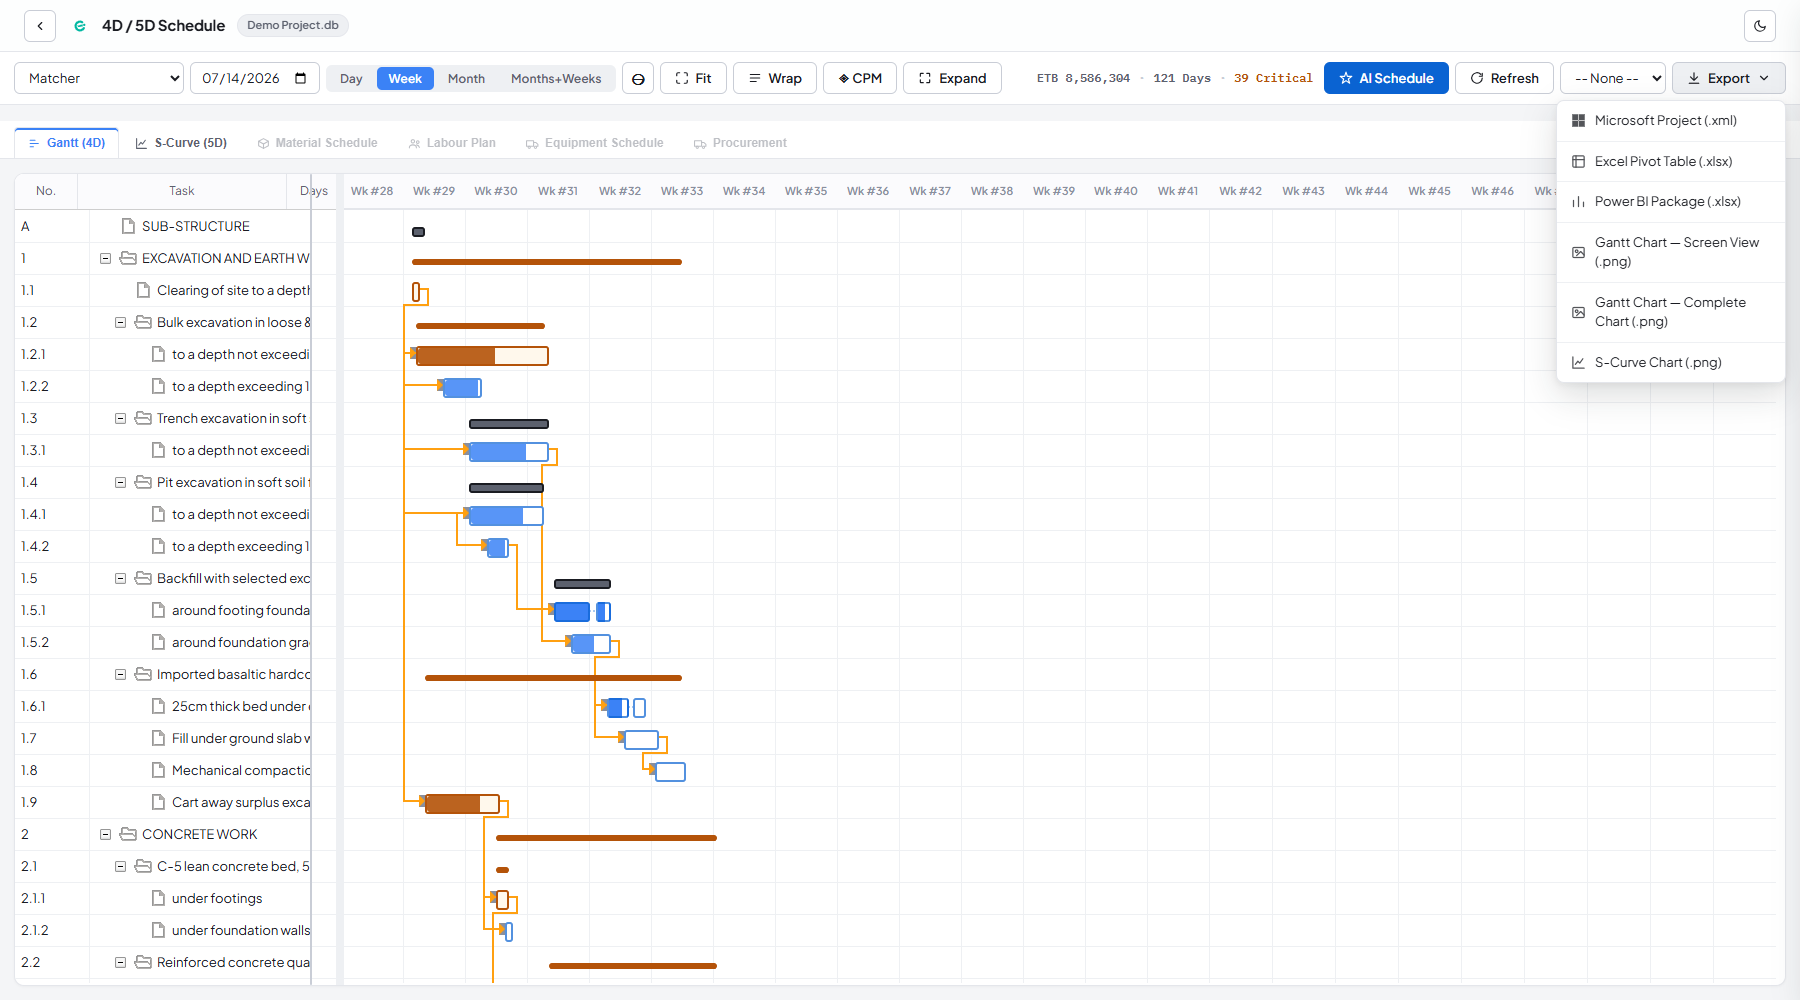
Click Export and choose a format: Microsoft Project (.xml) or Excel Pivot Table (.xlsx) to hand off the programme, Power BI Package (.xlsx) for a dashboard, or one of the three PNG chart exports for a quick image.
What you should see
A Gantt with linked tasks and a visible critical path, an S-curve with a "Good" or "Fair" quality badge, and an exported file that opens correctly in the target application.
If something's wrong
| Symptom | Where to look |
|---|---|
| Every task is exactly one day long | Items are missing URAs — see Coverage, URA & Cost Review |
| AI Schedule leaves several tasks amber | Unscheduled and Amber-Flagged Tasks |
| S-curve score stays "Poor" after several iterations | AI Schedule — Understanding the S-curve quality score |
| Your BOQ has 300+ items or 20+ sections and AI Schedule is slow | Handling Large BOQs |
Next
You've completed the full first-time workflow — tables, matching, price book, costing, and scheduling. For anything beyond this, the full reference documentation covers advanced matcher tuning, template curation, large-BOQ handling, and manual schedule adjustments in depth.