4D/5D Scheduling Overview
The 4D/5D schedule page opens in a separate browser tab from the main Conio interface. When you click the schedule link from within a project, Conio opens a dedicated scheduling workspace at the same localhost:8000 address. This separation keeps the heavy Gantt rendering isolated from the main estimating workflow, and allows you to have the schedule and the cost workspace open side by side.
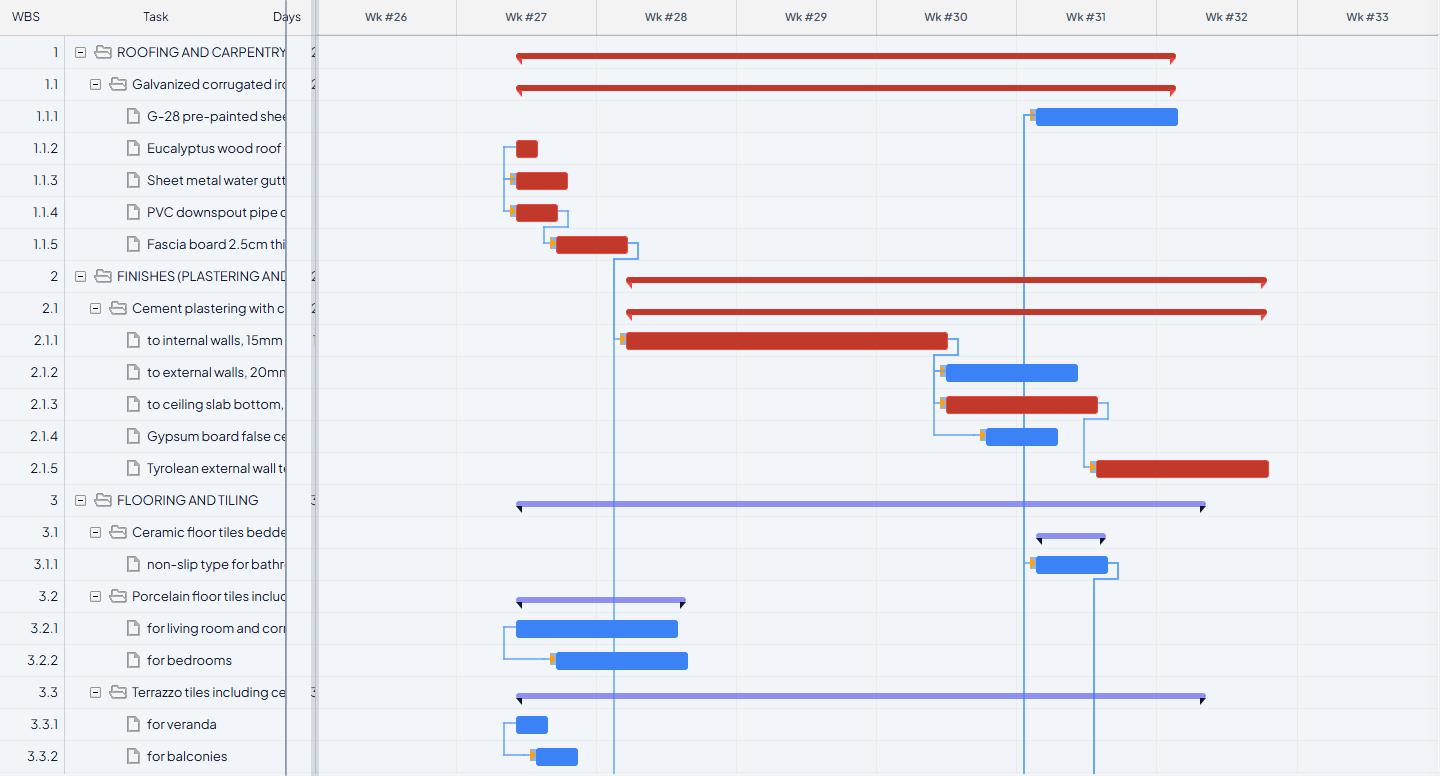
The "4D" in the name refers to the time dimension added to the three-dimensional cost model: tasks placed on a CPM (Critical Path Method) timeline with durations, predecessor links, and a calculated critical path. The "5D" refers to the cost dimension layered on top of that timeline — each task carries its item cost from the matched BOQ, and the schedule engine distributes that cost across the task's active working days. The result is a week-by-week or month-by-month cash-flow projection with an S-curve overlay.
The recommended workflow before opening the schedule is: import your BOQ, match rates in Scenario Studio, generate Unit Rate Analysis (URA) breakdowns for your matched items, and then synthesise the schedule. Durations are derived directly from the URA: the quantity of each BOQ item is divided by the daily output figure recorded in its URA to produce a duration in working days. Items without a URA receive a default one-day duration as a placeholder — this is flagged in the schedule so you know which tasks need URA data before the programme is reliable.
Predecessor links control the sequencing of tasks on the Gantt. You can draw links manually by dragging between task bars, or use the AI Schedule feature to have the system infer construction-logical links automatically. User-set links always take priority over AI-suggested links — the AI fills gaps, it does not overwrite your decisions.
Before the schedule produces meaningful output, at least one item in the scenario must have a URA with a daily output figure. A scenario with only matched rates but no URAs will produce a schedule where every task is one day long, which is not useful for programming or cash-flow forecasting. The more items with URAs, the more accurate the duration profile and the more reliable the S-curve.
What each view shows
| View | What it shows |
|---|---|
| Gantt chart | Task bars, durations, critical path (red), dependencies, progress |
| S-curve | Cumulative cost vs time; quality badge shows distribution score |
| Cash flow | Periodic spend per week or month; used to assess front-loading |
| Critical path | Highlighted tasks with zero float; delays here delay project completion |
Setting up the calendar and start date
The CPM engine needs a working calendar and a start date before it can convert task durations into real dates. There are two places this is configured:
Project-wide defaults (Settings → Project Calendar)
- Open Settings → Project Calendar.
- Check/uncheck Working Days to define your working week (defaults to Monday–Saturday).
- Add public holidays under Holiday Exceptions — click Add Date for a single date, or Import .ics to bring in a calendar file of holidays at once.
- Click Save Calendar.
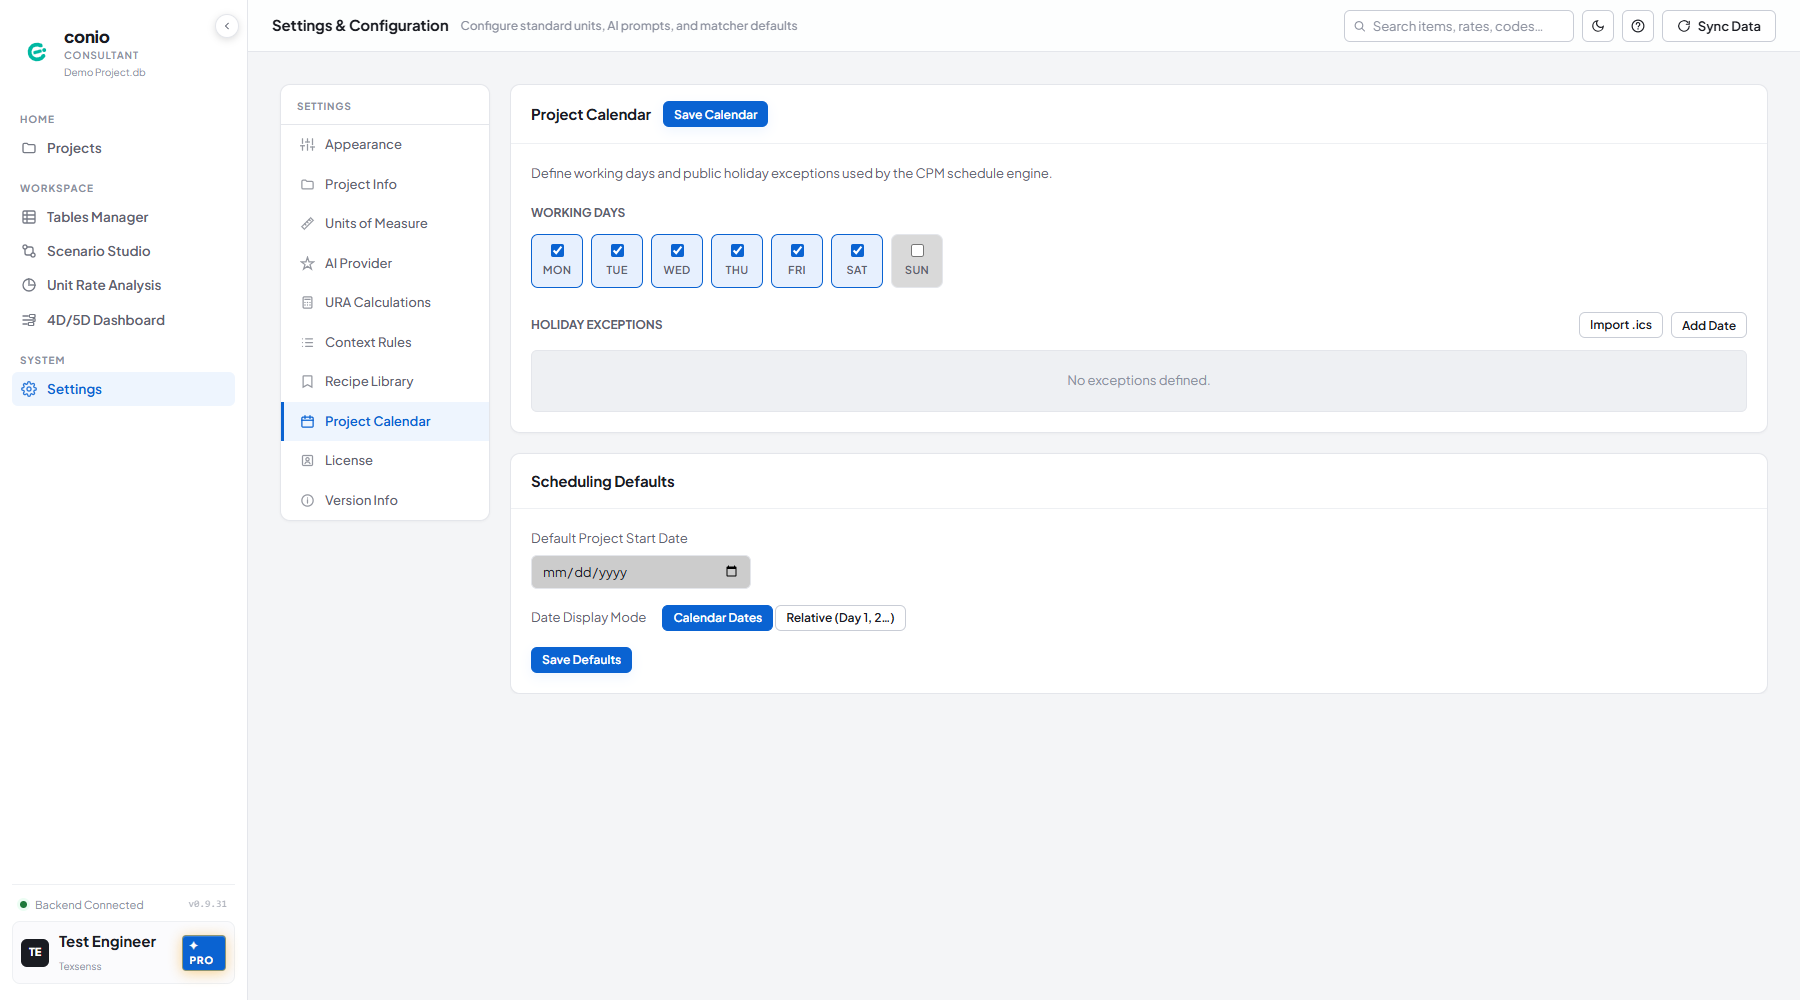
Below the calendar, the Scheduling Defaults card sets a Default Project Start Date and a Date Display Mode (Calendar Dates, or Relative — Day 1, 2…) applied to new scenarios. Click Save Defaults.
Per-scenario start date (schedule toolbar)
Each scenario can override the default with its own start date, set directly in the schedule page's toolbar:

Change the date field next to the scenario dropdown, then click Refresh to re-synthesise the schedule from the new start date.
Exporting the schedule
Click Export in the schedule toolbar for a menu of six formats:
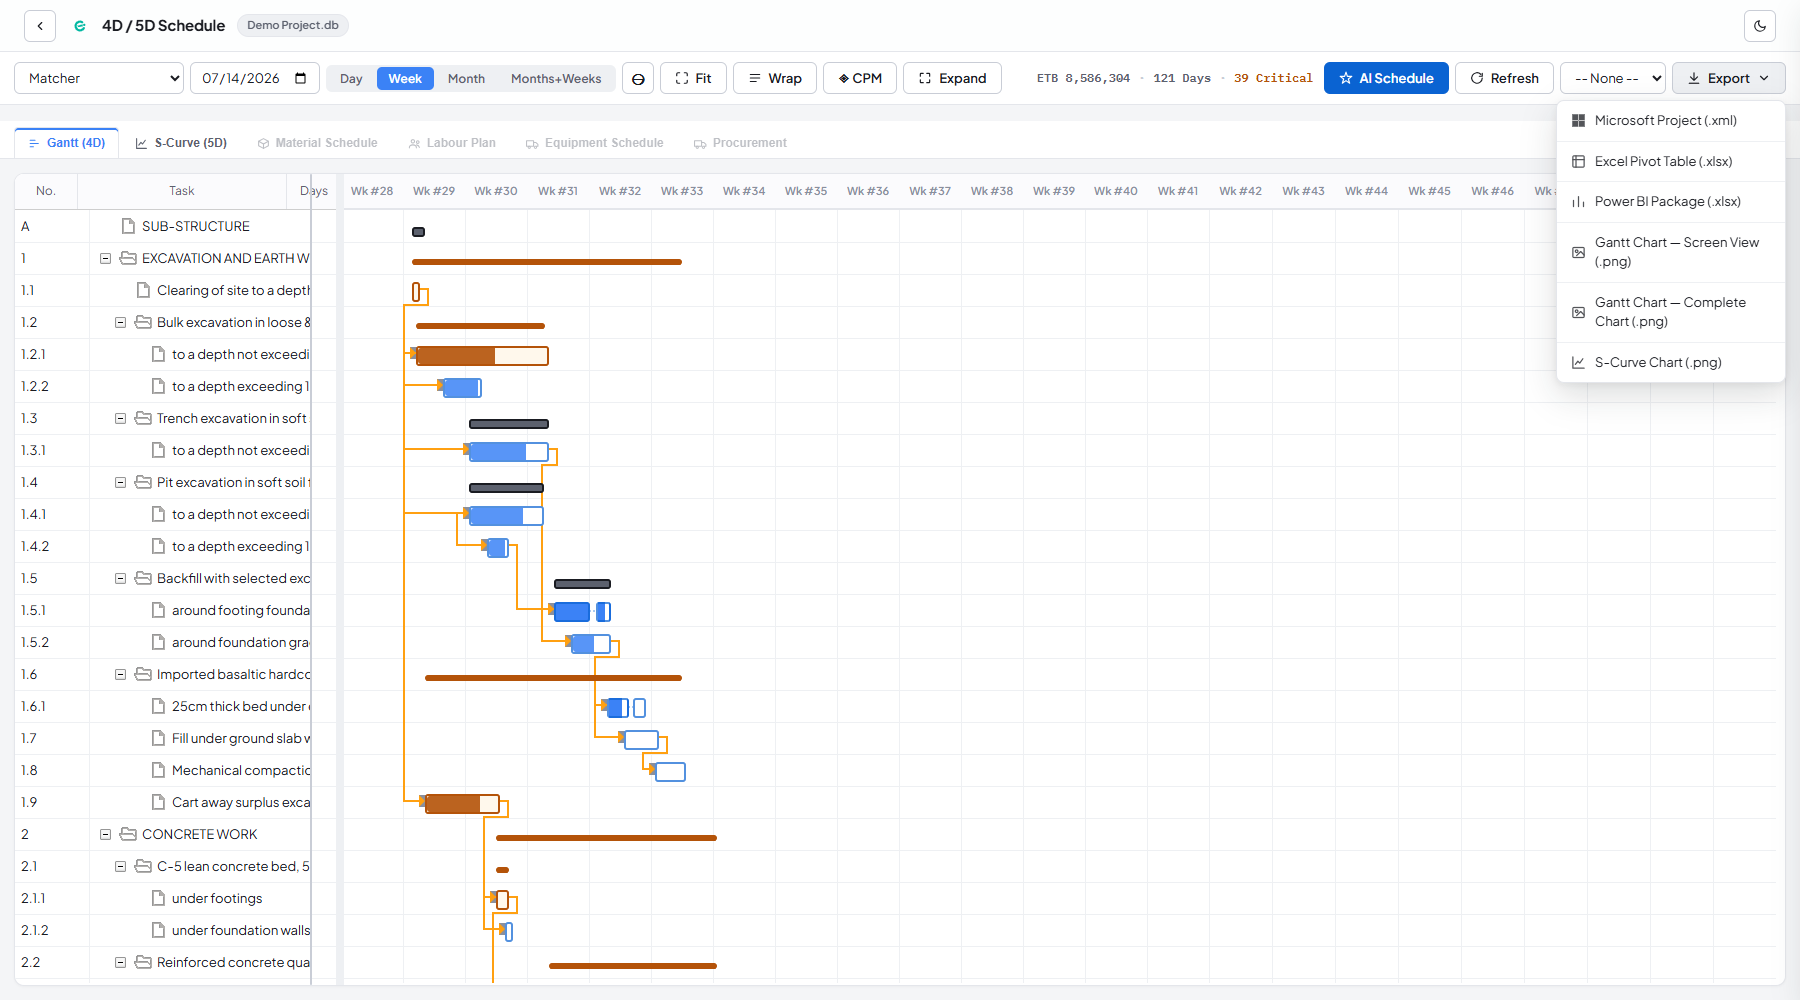
| Format | Use for |
|---|---|
| Microsoft Project (.xml) | Opening the programme in MS Project or Primavera |
| Excel Pivot Table (.xlsx) | Ad-hoc analysis or sharing with non-Conio users |
| Power BI Package (.xlsx) | Feeding a Power BI dashboard |
| Gantt Chart — Screen View (.png) | A quick image of exactly what's currently visible on screen |
| Gantt Chart — Complete Chart (.png) | A full image of the entire programme, not just the visible viewport |
| S-Curve Chart (.png) | The cash-flow S-curve as a standalone image, e.g. for a report |